
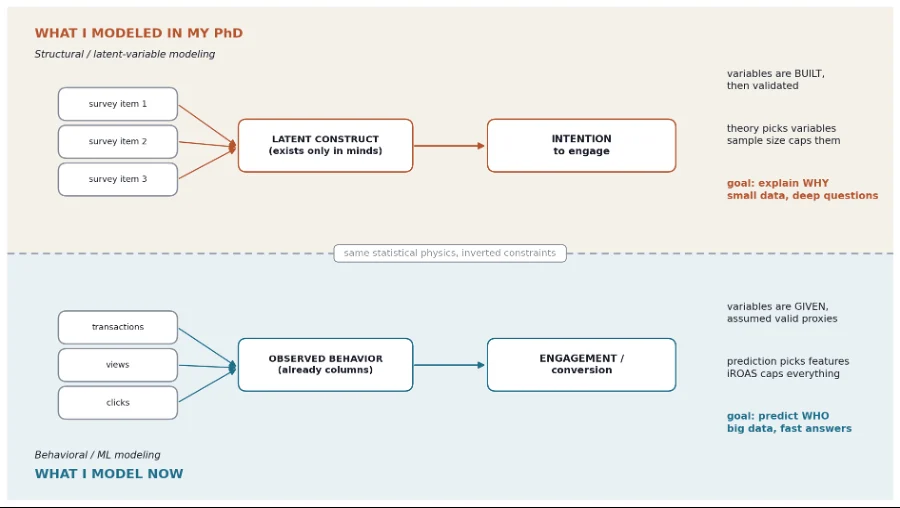
The evolution of data science has created a professional landscape where two practitioners might use the same terminology to describe fundamentally different mathematical realities. In the specialized fields of social science and ad measurement, the term "engagement" serves as a primary example of this divergence. While an academic researcher might define engagement as a psychological intention captured through survey instruments, a commercial data scientist defines it as a discrete, logged event such as a click or a purchase. This distinction, though seemingly semantic, dictates every downstream modeling decision, from variable selection to the determination of statistical significance.
The Conceptual Divide: Intention vs. Action
The transition from academic research to industry-scale measurement science reveals a profound inversion of methodology. In the academic sphere, specifically within the social sciences, the objective is often to predict a "state of mind." For instance, a researcher studying senior citizens’ interactions with adaptive clothing brands must rely on the Technology Acceptance Model (TAM), a framework established by Fred Davis in 1989. In this world, predictors like "perceived usefulness" or "privacy concern" do not exist as ready-made columns in a database. They are latent constructs—variables that live in a person’s head and must be reconstructed from indirect evidence.
Conversely, in the modern ad-measurement environment, the data scientist works with behavioral "truth." A purchase is a binary state recorded in a transactional database; a click is a timestamped log. There is no need to reconstruct the variable because the variable is the event itself. However, as industry experts note, this convenience comes with a hidden cost: the loss of the "why" behind the data.
The Academic Framework: Structural Equation Modeling
In the academic world, the primary challenge is measurement error. When a researcher asks a survey respondent about their "intent to engage," the answer is filtered through personal bias, question wording, and social desirability. To mitigate this, social scientists use Structural Equation Modeling (SEM).
SEM allows researchers to fit two linked models simultaneously:
- The Measurement Model: This defines a latent construct by grouping several survey items (indicators) that circle the same idea. The shared variance across these items represents the construct, while the unique variance is discarded as error.
- The Structural Model: This estimates the relationships between these constructed latent variables.
Using libraries such as semopy in Python, a researcher defines a construct using the =~ operator. For example, privacy_concern =~ privacy1 + privacy2 + privacy3. This requires the researcher to "prove" the variable exists before it can be used to predict an outcome. Statistical metrics such as Cronbach’s alpha and Average Variance Extracted (AVE) serve as the gatekeepers of validity. In this environment, adding a variable is "expensive" because every new construct requires more survey respondents to maintain statistical power. Consequently, theory—not raw data—dictates the model’s structure.
The Industry Framework: Supervised Machine Learning
Upon entering the commercial sector, the constraints of data scarcity and measurement modeling often vanish, replaced by the challenges of scale and "messy" real-world signals. In ad measurement, a propensity model—designed to predict who is likely to convert—is typically built using supervised learning algorithms like XGBoost.

In this world, the features are observed behaviors:
- Recency: Days since the last interaction.
- Frequency: Number of visits in a 90-day window.
- Monetary Value: Total spend in a given period.
- Category Views: Digital footprints indicating interest.
The model specification for a binary classifier in XGBoost skips the construct-building phase entirely. There are no =~ operators because the features are taken at face value. However, the underlying psychological reality remains. A "category view" is still just a proxy for "interest," but in a production environment, the validity of that proxy is rarely questioned until the model fails to deliver incremental value.
Case Study: The Privacy Paradox and Null Results
A pivotal example of the difference between these two worlds can be found in the study of privacy concerns. In a dissertation project modeling why older adults engage with brands, a researcher might expect "privacy concern" to be a dominant predictor. Because engaging with adaptive clothing brands often requires disclosing a disability, privacy should, in theory, act as a significant barrier.
During the modeling phase, the researcher might find that one of the three survey items intended to measure privacy behaves erratically, loading negatively against the others. In the academic world, this "bad" indicator is pruned to ensure the construct’s purity. Yet, even after refining the measurement, the final structural model might show that privacy concern has no significant effect on the intention to engage.
In academia, reporting this null result is a requirement of the scientific method. In industry, a similar "null" result—such as a marketing campaign that fails to produce a "lift" in sales—is not just a finding; it is a financial diagnostic. It signals that a fundamental assumption in the business logic has failed.
Methodological Inversions: The Role of Correlation
One of the most striking differences between social science modeling and machine learning is the treatment of correlated inputs.
In Structural Equation Modeling, correlation among indicators within a construct is the goal. It proves that the items are measuring the same underlying phenomenon. High internal consistency is a hallmark of a healthy measurement model.
In predictive machine learning, however, redundancy among features (multicollinearity) is a liability. It can destabilize linear coefficients and "smear" feature importance in tree-based models, making it difficult for stakeholders to understand which lever actually drives the outcome. The reconciliation lies in the model’s purpose:

- Explanation (Academic): Correlated inputs are necessary to define the "what."
- Prediction (Industry): Correlated inputs are noise that must be managed to clarify the "who."
The "Why" Gap: A Chronology of a Failed Lift Test
While behavioral models excel at identifying who will act, they are often silent on why they act. This limitation becomes apparent during "lift" measurement—the process of determining if an advertisement actually caused a sale that wouldn’t have happened otherwise.
Consider a scenario involving a geo-lift test for a snack-category product. The data might show a "negative lift," suggesting that the advertisements caused consumers to buy less of the product. In a purely algorithmic world, one might conclude the ad backfired. However, a deeper analysis often reveals a failure of the "counterfactual" assumption.
Timeline of a Diagnostic Investigation:
- Pre-Test: Groups (regions) are matched based on historical sales data to ensure they move in sync.
- Campaign Launch: Ads are served to the "test" region while the "control" region remains unexposed.
- The Result: The test region shows lower sales growth than the control region during the window.
- The Investigation: Analysts pull two-year regional trends and discover a "category-timing gap."
- The Finding: The test region naturally hits its seasonal peak two weeks later than the control region. The "negative lift" was actually just the two regions following their independent seasonal rhythms, which the pre-period alignment failed to account for.
This highlights a critical rule in measurement science: pre-period alignment validates the past, not the future. Any force that hits groups on different schedules—seasonality, regional promotions, or supply chain shocks—can invalidate a causal claim.
Broader Implications for Data Science
The convergence of these two fields suggests that the most valuable skill for a modern analyst is not the mastery of a specific tool, but the ability to recognize the relationship between a proxy and its target.
A Field Guide for Practitioners:
- When the outcome is an attitude: You are in measurement-model territory. You must prove your variables are valid before you trust your regression.
- When the outcome is a behavior: Your variables are "free," but you must remain vigilant. Every column is a proxy that can "drift" or be gamed.
- When the estimate is nonsensical: Treat it as a diagnostic. An implausible coefficient is usually a sign that a hidden assumption—such as group stationarity—has collapsed.
Conclusion: The Lasting Value of Social Science Training
As machine learning becomes more automated, the "human-in-the-loop" role shifts toward construct validity and causal logic. The training provided by social science—the discipline of defining what can’t be seen and questioning the "why" behind the "what"—is increasingly relevant in a world of abundant, but often misleading, behavioral data.
The fundamental discipline remains identical across both worlds: commit to the question before seeing the answer, and document every caveat. Whether the enforcement mechanism is an academic committee or a corporate budget, the integrity of the model depends on the researcher’s ability to distinguish between a variable that looks like a result and a variable that truly represents the underlying human reality. In the end, the methods are merely local dialects; the core logic of measurement is the universal language.

