

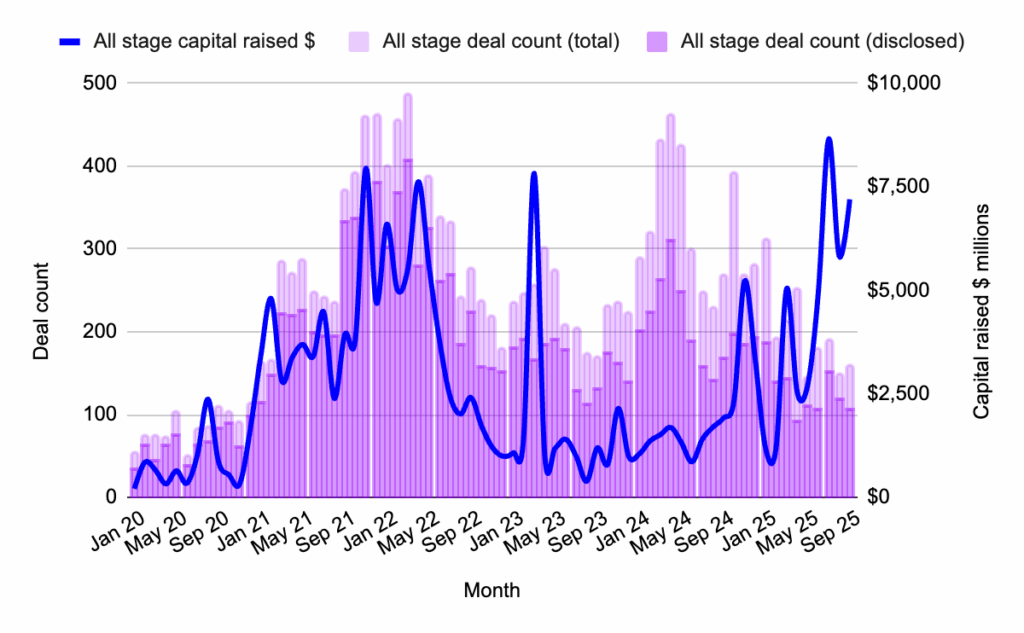
September 2025 marked a significant rebound in Web3 fundraising, with a total of $7.2 billion secured across 160 deals. This figure represents the highest capital deployment since the spring surge earlier in the year, indicating a renewed, albeit concentrated, appetite for investment within the decentralized technology sector. However, a closer examination of the data reveals a market heavily weighted towards late-stage ventures, with early-stage funding continuing its protracted decline. The notable exception to this trend was the substantial seed-stage raise by Flying Tulip, which, while exceptional, did not fundamentally alter the late-stage dominance that has characterized the investment landscape for the past two months.
This trend aligns with insights gathered from major industry events such as Token2049 Singapore, where discussions consistently pointed towards a maturing market. Venture capitalists appear increasingly focused on established projects with demonstrable traction and a clearer path to liquidity, signaling a shift from the speculative exuberance of earlier periods. While early-stage dealmaking persists, the substantial capital injections are predominantly targeting companies that have already navigated significant developmental hurdles.
Market Overview: A Strong but Top-Heavy Landscape
The figures for September 2025, as visualized in Figure 1, suggest a robust return of risk capital. However, this impression is tempered by the distribution of these funds. With the singular exception of Flying Tulip’s impressive seed-stage round, the overwhelming majority of capital was channeled into companies further along their growth trajectories. This pattern, which has been observed consistently over the preceding quarters, underscores a prevailing investor sentiment: the real money is being deployed in pursuit of maturity and demonstrable market value.
Market Highlight: Flying Tulip’s Landmark Seed Round
The most striking development of September 2025 was Flying Tulip’s monumental $200 million seed funding round, achieving a unicorn valuation of $1 billion. This unprecedented raise at such an early stage signifies a strong conviction in the project’s ambitious vision. Flying Tulip aims to revolutionize decentralized finance (DeFi) by creating a unified on-chain exchange that integrates spot trading, perpetual futures, lending, and structured yield products. Its innovative approach leverages a hybrid Automated Market Maker (AMM) and order book model, coupled with cross-chain deposit capabilities and advanced volatility-adjusted lending mechanisms. This deal not only bolstered the seed-stage funding figures for the month but also highlighted a new paradigm in capital allocation and protocol design within the Web3 ecosystem.
New Crypto/Web3 Venture Funds: Sharper Theses, Smaller Bites
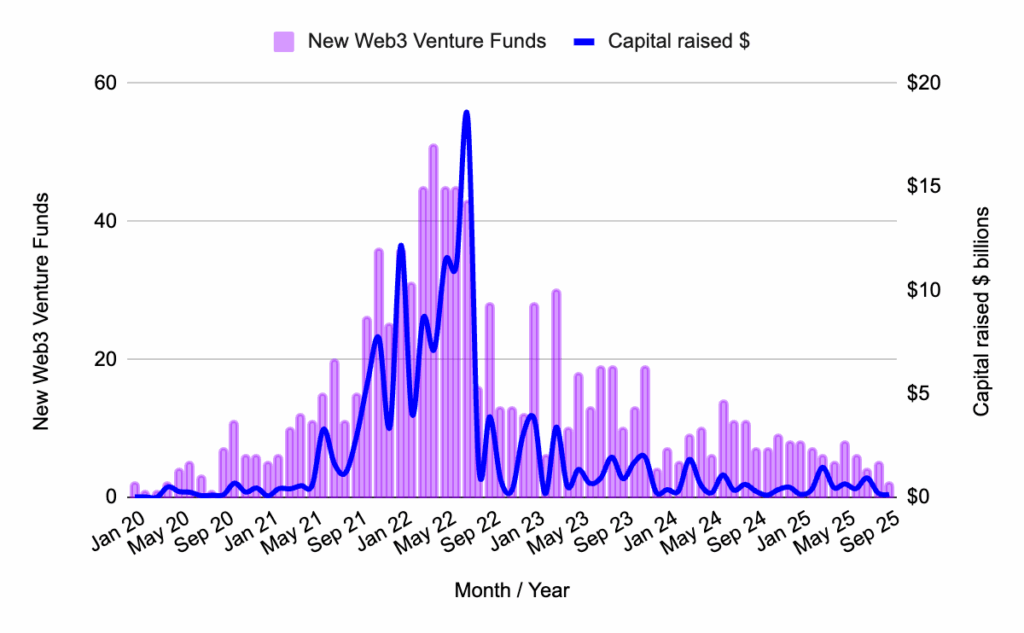
The formation of new venture capital funds in September 2025 reflected a more discerning approach to investment. As illustrated in Figure 2, only two new funds were launched during the month, both characterized by their relatively modest size and highly specialized, thematic investment theses. This trend suggests not a slowdown in fundraising for VCs, but rather a strategic recalibration towards identifying and capitalizing on niche opportunities within the Web3 space. The focus appears to be on targeted investments that align with specific technological advancements or emerging market trends, rather than broad-spectrum portfolio diversification.
Pre-Seed Rounds: A Nine-Month Downturn Continues
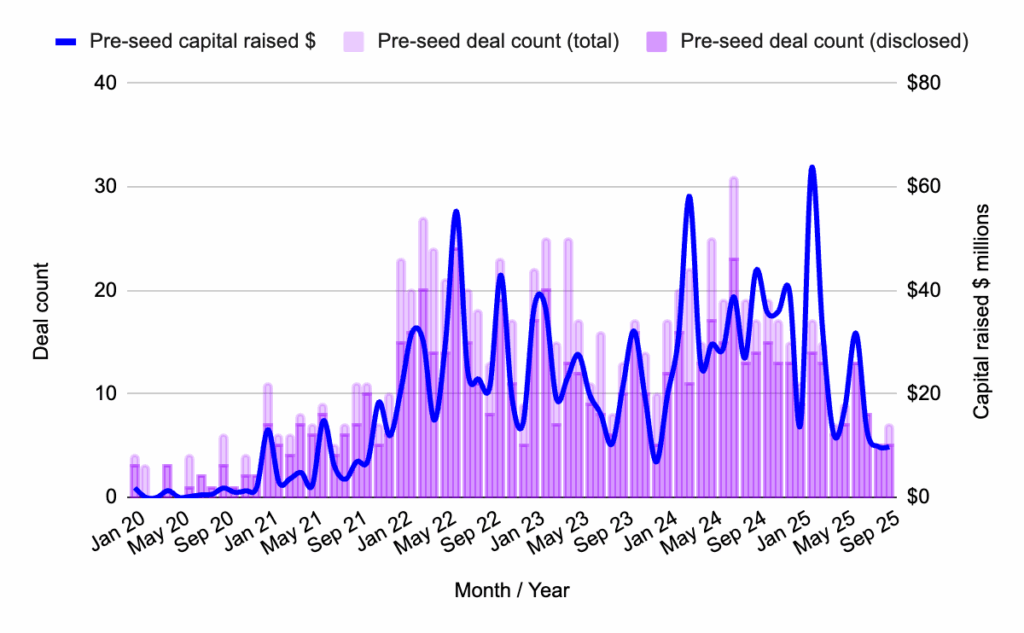
The pre-seed funding landscape in September 2025 remained subdued, continuing a downward trend observed for the past nine months. Figure 3 clearly depicts a slump in both the number of deals and the total capital raised at this critical early stage. The pre-seed segment is characterized by a scarcity of capital, with few prominent investors actively participating. For founders operating at this level, securing funding requires exceptionally compelling narratives and a demonstrable, deep technical understanding of their proposed solutions.
Pre-Seed Highlight: Melee Markets’ Innovative Approach
Despite the overall sluggishness, Melee Markets emerged as a noteworthy pre-seed success, raising $3.5 million. Built on the Solana blockchain, Melee Markets offers a unique platform that allows users to speculate on influencers, trending topics, and significant events, effectively blending prediction markets with social trading. This innovative concept, backed by prominent investors like Variant and DBA, seeks to capitalize on the burgeoning attention economy as a distinct asset class.
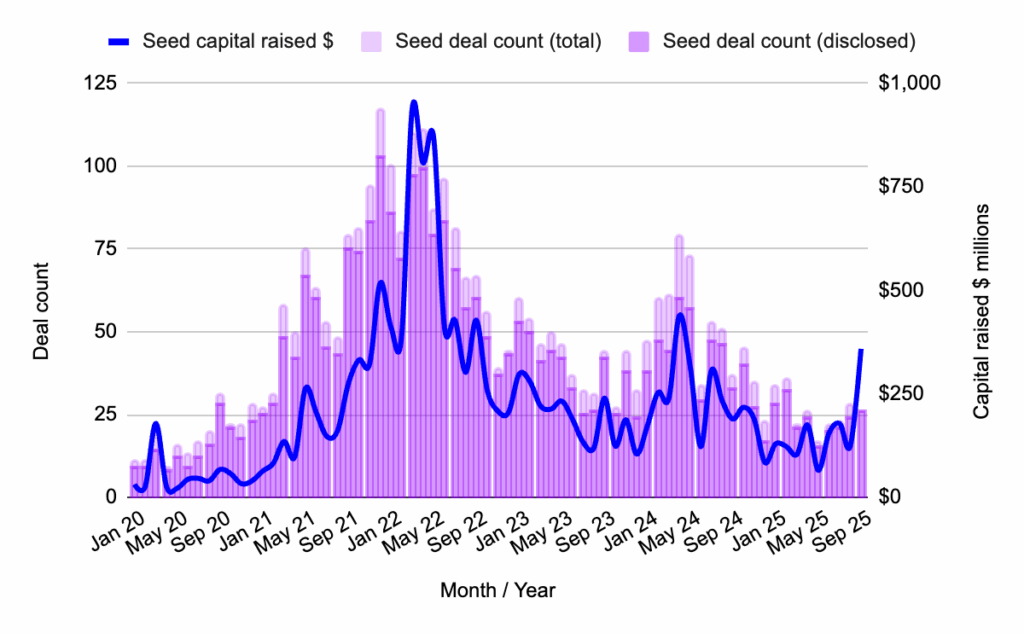
Seed Rounds: Flying Tulip Dominates, Redefining Capital Efficiency
As previously highlighted, seed-stage funding experienced a significant uplift in September 2025, largely due to the exceptional performance of Flying Tulip. Without this single large round, the seed-stage market would have remained largely consistent with previous months, as shown in Figure 4. However, the implications of Flying Tulip’s raise extend far beyond mere statistics.
The structure of Flying Tulip’s funding round is particularly noteworthy. Unlike traditional equity-based investments, its on-chain redemption rights provide investors with a degree of capital security and direct exposure to yield generation, without compromising potential upside. Furthermore, the project’s strategic approach to capital utilization is revolutionary. Instead of simply holding the raised funds, Flying Tulip intends to deploy its capital within DeFi protocols to generate yield, which will then be used to fuel growth, incentivize network participation, and execute buyback programs. This DeFi-native model of capital efficiency could serve as a blueprint for future Web3 protocol fundraising, offering a more sustainable and performance-driven alternative to conventional methods.
While investors in Flying Tulip retain the right to withdraw their capital at any time, this substantial investment represents a significant shift. It indicates a growing preference among Web3 venture capitalists for more liquid asset exposure, moving away from traditional, illiquid instruments like SAFEs (Simple Agreement for Future Equity) and SAFTs (Simple Agreement for Future Tokens) towards mechanisms that offer greater flexibility and yield potential.
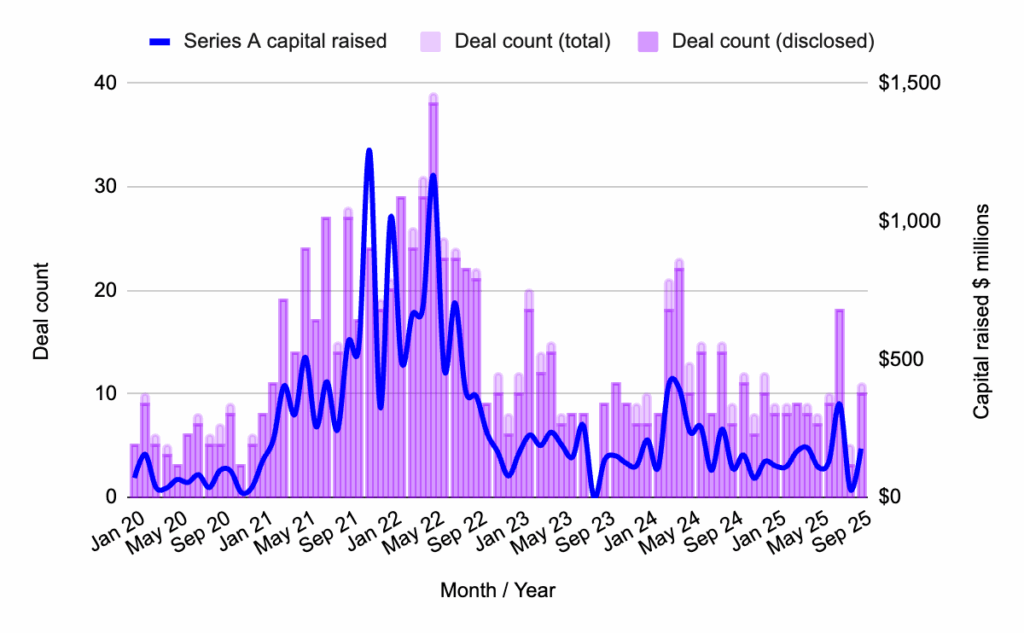
Series A: A Period of Stabilization
Following a notable dip in August, Series A funding demonstrated a slight recovery in September 2025. While not a breakout month, the deal volume and capital deployed settled around the average for the year, as depicted in Figure 5. This stabilization suggests that investors are maintaining a cautious yet consistent approach at this stage. The emphasis remains on backing projects that have already achieved significant market traction and demonstrated clear product-market fit, rather than speculating on nascent ideas.
Series A Highlight: Digital Entertainment Asset’s Cross-Industry Integration
Singapore-based Digital Entertainment Asset (DEA) secured $38 million in Series A funding, signaling continued investment in the intersection of blockchain technology with mainstream consumer industries. DEA’s mission is to develop platforms for Web3 gaming, Environmental, Social, and Governance (ESG) initiatives, and advertising, all designed to offer real-world payouts. The backing from industry heavyweights like SBI Holdings and ASICS Ventures underscores Asia’s sustained interest in leveraging blockchain for innovative applications across diverse sectors.
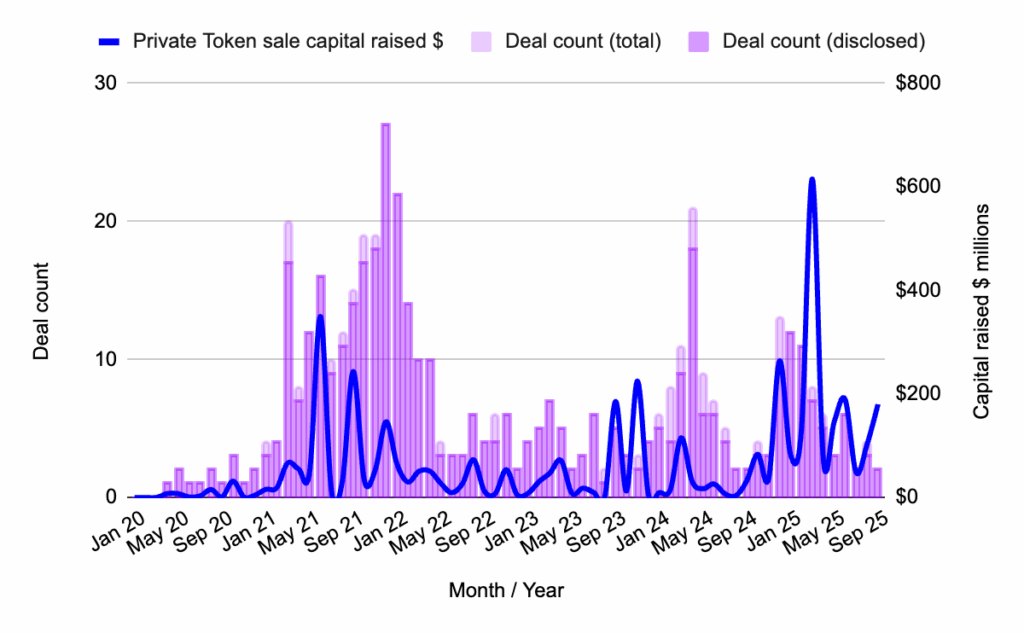
Private Token Sales: Mega-Rounds and Established Players
The private token sale market in September 2025 continued its trend of consolidation, with a few mega-rounds accounting for the bulk of the capital raised, as evidenced by Figure 6. The pattern observed in recent months persists: a reduction in the overall number of token rounds, larger individual investment checks, and a significant portion of liquidity being absorbed by exchange-driven initiatives. This suggests that major centralized exchanges and their associated token offerings continue to be a dominant force in private market liquidity.
Highlight: Crypto.com’s Strategic Investment
A standout event in private token sales was Crypto.com’s substantial $178 million raise. While details remain somewhat opaque, reports indicate a strategic partnership with Trump Media. This significant funding round underscores Crypto.com’s ongoing commitment to expanding its global reach and developing user-friendly tools for mass-market crypto adoption. Whether this move represents a fundamental shift in brand strategy or a calculated public relations maneuver, it has certainly captured significant attention within the industry.
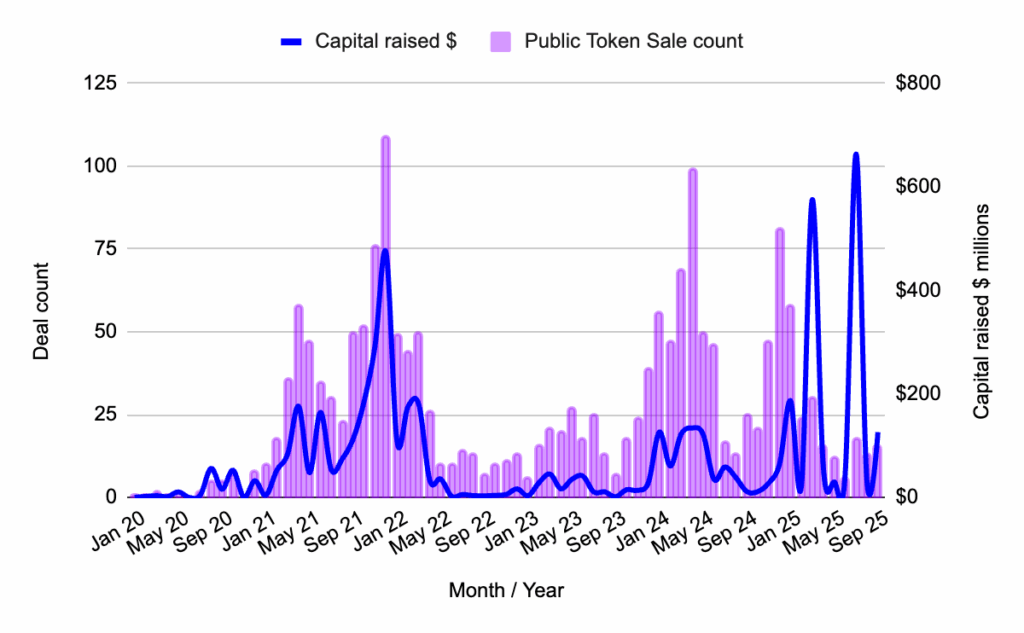
Public Token Sales: The Rise of Bitcoin Yield and AI Narratives
Public token sales in September 2025 remained dynamic, driven by two powerful and evolving narratives: Bitcoin yield (BTCFi) and Artificial Intelligence (AI) agents. Figure 7 illustrates the activity in this segment, confirming that public markets continue to be highly responsive to compelling, narrative-driven investment themes. The growing interest in bringing Bitcoin’s vast liquidity and security into the DeFi ecosystem is a testament to the maturation of the broader crypto landscape.
Highlight: Lombard’s Innovation in Bitcoin DeFi
Lombard emerged as a key player in the BTCFi narrative, raising $94.7 million. The company is focused on integrating Bitcoin into the decentralized finance space through LBTC, a novel yield-bearing, cross-chain, and liquid Bitcoin asset. The objective is to create a unified liquidity layer for Bitcoin across various blockchain ecosystems. This initiative is a prime example of the burgeoning BTCFi trend, where Bitcoin is increasingly being reimagined not just as a store of value, but as an active generator of yield within the DeFi ecosystem.
Recruiting Now: Injective Ecosystem Builder Catalyst
The current investment climate clearly favors projects that can articulate sharp, well-defined narratives, demonstrate robust infrastructure, and are led by founders adept at aligning with powerful, established ecosystems. This is precisely the environment that the Injective Ecosystem Builder Catalyst program is designed to foster.
The Injective Ecosystem Cohort offers a specialized program for early-stage teams aiming to build within one of Web3’s most dynamic ecosystems. Whether the focus is on developing next-generation DeFi protocols, unlocking cross-chain liquidity, or innovating in areas such as trading, derivatives, and decentralized infrastructure, the program provides crucial support to help teams translate their conviction into tangible traction. Applications for this cohort are currently open, signaling continued opportunities for ambitious builders in the Web3 space.
In conclusion, September 2025 showcased a Web3 fundraising environment that, while robust in total capital deployed, was heavily skewed towards later-stage companies and token raises. Early-stage activity remained constrained. The unique fundraising model employed by Flying Tulip offered a tantalizing glimpse into potential future fundraising strategies, characterized by capital efficiency and DeFi integration. However, for the present, it stands as an exceptional case rather than a widespread industry shift. The market’s preference for maturity and liquidity, coupled with the continued influence of established players and narrative-driven public sales, paints a complex but evolving picture of Web3 investment.
