
The rapid evolution of big data has fundamentally altered the landscape of predictive modeling, shifting the focus from simple variable selection to the complex management of model stability. As data scientists and econometricians grapple with an exponential increase in available metrics—ranging from real-time weather patterns to nuanced user behavior history—the distinction between a model’s accuracy and its structural stability has become a critical guardrail in the deployment of reliable algorithms. While accuracy measures what a model learns in terms of forecast precision, stability measures how the model learns and whether its internal logic remains consistent across different subsets of data or under conditions of minor environmental perturbation.

In the contemporary modeling environment, the proliferation of variables has created a double-edged sword. For example, modern recommendation engines no longer rely solely on basic historical data; they now integrate dynamic metrics such as the time of day, potential mood indicators, and the "shelf life" of digital interactions. This abundance of data allows for highly granular correlations, yet it also increases the risk of identifying causal relationships that do not exist or are merely coincidental. The challenge for modern analysts is determining which variables to retain and which to discard, especially when a variable may be significant for one segment of the population but irrelevant for another. This necessitates a move toward "model stability," a metric that ensures an algorithm can be applied generally and does not produce volatile results when faced with slight variations in input data.
The Evolution of Algorithmic Guardrails and Market Volatility
The importance of separating stability from accuracy is perhaps most visible in the high-stakes environment of financial markets. High-frequency trading (HFT) algorithms are designed for extreme accuracy and speed; however, their complexity can lead to catastrophic failures during periods of high volatility. This was starkly demonstrated on March 9, 2020, when the global markets experienced a historic sell-off triggered by the onset of the COVID-19 pandemic and a simultaneous oil price war.

As securities prices became highly volatile, many automated trading models entered a state of instability, unable to make "accurate" decisions because the underlying data distribution had shifted beyond their training parameters. This event forced the NASDAQ and other major exchanges to activate "circuit breakers," temporary halts in trading designed to allow human intervention and prevent a complete algorithmic collapse. The March 2020 event serves as a definitive case study in the dangers of prioritizing accuracy over robustness. When models reach a certain threshold of environmental stress, they can no longer be trusted to maintain stable decision-making, regardless of their historical performance.
This historical precedent has prompted a re-evaluation of how stability is defined within the broader data science community. Generally, a stable model is one that consistently identifies the same set of relevant variables across different datasets, maintains the ordinality of those variables’ importance, and can be applied to a wide range of users without requiring constant recalibration.

Methodological Differences: Machine Learning vs. Econometrics
Defining stability requires different approaches depending on the mathematical domain of the model. In the field of machine learning, stability is often measured using k-fold or n-fold cross-validation. This process involves partitioning data into several subsets, training the model on some folds, and validating it on others to ensure that the learning mechanism is not overly sensitive to any specific data point.
However, these traditional cross-validation techniques are often unsuitable for econometrics. Econometric modeling primarily operates in the "frequency" domain, where data points have temporal relationships. In time-series forecasting, a value at time t is frequently correlated with its previous values (lags) at t-1, t-2, and so on. Randomly subsetting this data, as one would in k-fold cross-validation, destroys these temporal dependencies, rendering the validation process moot.

To address this, econometricians utilize "rolling validation." This technique preserves the chronological order of data, testing the model on sequential windows of time. While rolling validation is traditionally used to measure out-of-sample forecast accuracy, it can also be used to track how model coefficients evolve as new data is added. If a model’s coefficients fluctuate wildly with every new data point, the model is considered unstable, even if its short-term forecasts appear accurate.
Analysis of the auto.arima Algorithm and Coefficient Convergence
A primary tool in time-series analysis is the Autoregressive Integrated Moving Average (ARIMA) model. In the R programming language, the auto.arima function within the forecast package is widely used to automate the selection of the best model structure. This selection is typically based on the Akaike Information Criterion (AIC), a metric that balances model fit with parsimony to reduce error.

While the AIC is effective at improving accuracy, it does not inherently account for stability. To test the stability of the auto.arima algorithm, researchers often use simulated Autoregressive (AR) processes where the true coefficients are known a-priori. In a controlled simulation of an AR process with four lags and a coefficient vector of 0.7, -0.2, 0.5, -0.8, observations revealed that the algorithm requires a significant amount of data to reach structural stability.
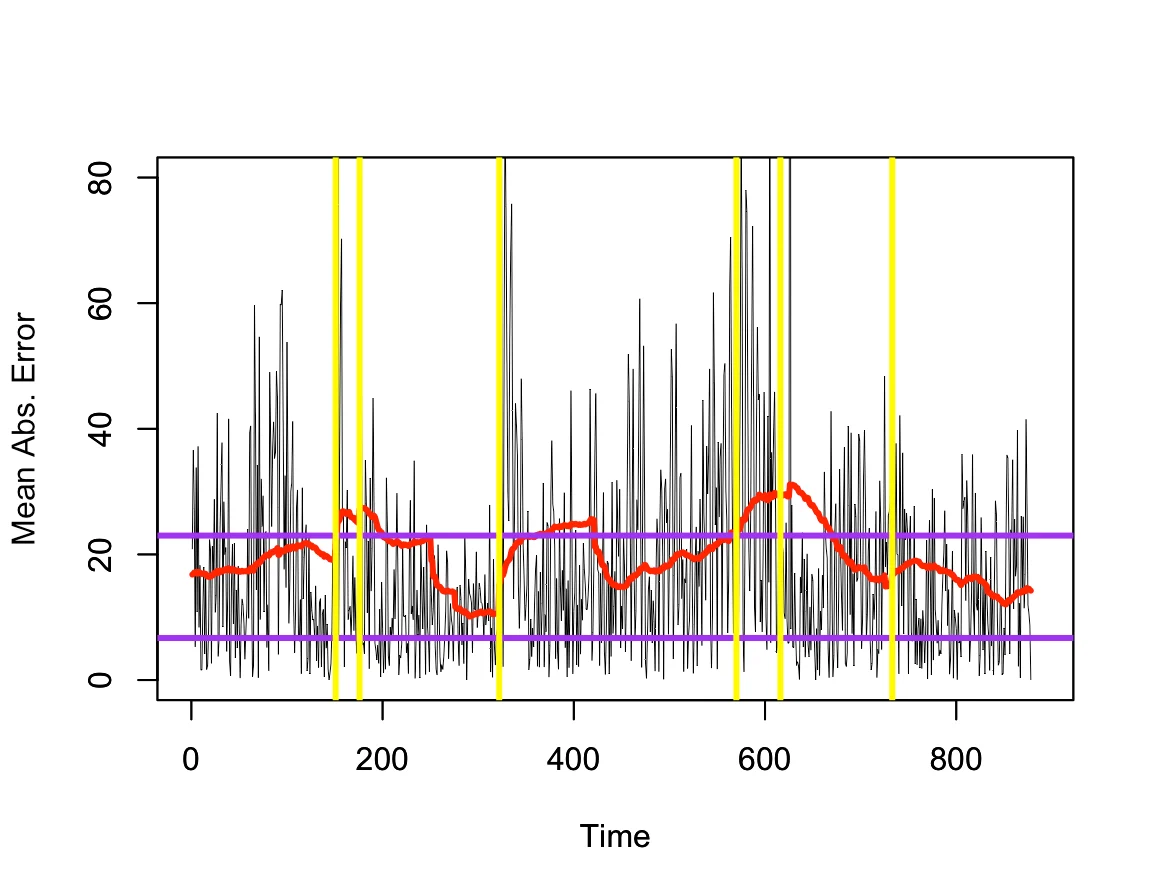
Data indicates that for a time series of 1,000 periods, the auto.arima algorithm may take approximately 400 data points to converge on a numerically stable and accurate solution for the coefficients. Notably, during the first 200 data points, the out-of-sample accuracy may remain comparable to the later stages, yet the model itself remains highly volatile. The coefficients calculated in the early stages are often far from the "true" values, suggesting that the model’s "accuracy" in the short term is more a result of chance than a reflection of the underlying data dynamics. This highlights a critical insight: a model can be accurate by accident, but it can only be robust by design.

The Impact of Random Discontinuities and Shocks
The true test of model stability occurs when the training data contains random discontinuities or "shocks" that do not follow the underlying dynamics of the time series. In many real-world scenarios, data is "noisy" or contains outliers caused by external events that are unlikely to repeat in a predictable pattern.
When random shocks are introduced into a simulated time series, the stability of the auto.arima algorithm is significantly compromised. In comparative tests, a perturbed version of a time series—one where random discontinuities were "sprinkled" into the data—resulted in a marked decrease in forecasting accuracy. More importantly, the model’s internal representation was completely altered. Instead of identifying the correct four AR lags, the algorithm incorrectly assigned non-zero values to Moving Average (MA) terms that did not exist in the original process.

This shift in the red-line (perturbed) vs. black-line (unperturbed) coefficient values demonstrates that even a few uncorrelated shocks can lead an algorithm to pick the wrong model representation. If the algorithm selects incorrect coefficients, the resulting forecasts will inevitably deviate from reality as the process continues. This finding underscores the necessity of "feature engineering" and data smoothing to remove bias before a model is trained.
Industry Implications and the Future of Econometric Workflow
The disconnect between stability and accuracy has profound implications for how organizations approach data-driven decision-making. In many professional settings, the standard workflow focuses almost exclusively on the final output—the forecast. However, if the algorithm has not reached a state of convergence, that forecast is effectively a "hunch" backed by unstable mathematics.

Industry experts suggest that breaking out stability from accuracy should become a standard part of the econometric workflow. By measuring both metrics independently, analysts can make informed decisions about whether to further engineer raw data or simplify their models. The principle of parsimony—choosing the simplest model that fits the data—should not be sacrificed for complex, "high-tech" models that offer marginal improvements in accuracy at the cost of significant instability.
The broader impact of these findings suggests a shift toward more responsible modeling. As artificial intelligence and automated forecasting become more integrated into public policy, healthcare, and infrastructure, the "black box" approach of only looking at final accuracy is no longer sufficient. Regulatory bodies and academic institutions are increasingly calling for a "rigorous framework" that ensures models are not just predicting the next data point, but are actually capturing the persistent structural truths of the systems they represent.

In conclusion, as we continue to generate more data every day than at any point in human history, the ability to distinguish between causal relationships and random noise will define the next generation of econometrics. Stability is the bridge that allows a model to move from a specific, localized success to a general, reliable tool. For the data science community, the goal is no longer just to be right, but to be consistently right for the right reasons.

