Token2049 Singapore 2025 has cemented its status as one of the definitive gatherings for the global cryptographic and blockchain industries, drawing tens of thousands of founders, investors, and policymakers to the Marina Bay Sands. However, beneath the bustling exhibition halls and high-energy networking events, a starkly different psychological climate prevailed compared to the euphoric bull-market summits of 2021 and 2022. Rather than fixating on speculative price trajectories and frictionless narrative-driven momentum, conversations among leading venture capitalists (VCs), Limited Partners (LPs), and ecosystem architects gravitated toward structural rigor, regulatory compliance, liquidity management, and data-backed accountability.
This recalibration represents a maturing asset class. As the Web3 venture capital ecosystem moves past its post-hype adolescence, market participants are confronting a landscape defined by tighter institutional scrutiny, shifting regional regulatory regimes, and a profound pivot from early-stage speculation to sustainable, fundamentals-driven growth.
The Evolution of Global Sentiment: From Speculation to Institutional Discipline
To understand the tonal shift at Token2049 Singapore 2025, one must examine the broader macroeconomic and regulatory backdrop that has evolved over the past several years. The 2020–2021 pandemic-era liquidity boom catalyzed a massive influx of capital into Web3, frequently characterized by loose underwriting standards, high-risk token allocations, and rapid-fire pre-seed rounds that rewarded marketing narratives over product-market fit.
By contrast, the events of 2023 and 2024 served as a harsh market filter. As regulatory scrutiny intensified globally, institutional investors—who supply the capital for venture funds—began demanding higher standards of governance, transparency, and verifiable yield. This evolution was initially previewed earlier in the year at Token2049 Dubai, but Singapore served as the definitive proving ground where this pragmatic realism was universally acknowledged.
At firms like Outlier Ventures, which has operated an accelerator and venture platform for over a decade, this shift is interpreted not as a contraction of the industry, but as a healthy biological evolution. Data has replaced hype as the primary currency of conviction. General Partners (GPs) are no longer making exploratory bets based solely on whitepapers; instead, they are relying on granular performance metrics, user retention rates, and real revenue generation to justify capital deployment.
Regional Rebalancing: The Changing Geography of Web3 Innovation
One of the most notable anecdotal and structural shifts observed during the conference circuit was the subtle rebalancing of regional focus between Singapore and South Korea. While Singapore remains a premier global hub, many conference attendees and founders noticeably prioritized South Korea Blockchain Week, reflecting Seoul’s rapidly expanding footprint in the virtual asset economy.
This geographical pivot is deeply tied to evolving regulatory frameworks across Asia. South Korea has made deliberate strides in formalizing its virtual asset regime, establishing clearer legal perimeters around institutional custody, taxation, and robust investor protection. These structured guidelines have given traditional financial institutions and local tech conglomerates the legal clarity required to engage deeply with blockchain technology.
Conversely, Singapore’s Monetary Authority (MAS) has systematically tightened its licensing and registration requirements. Even offshore-facing crypto entities are now subjected to rigorous local compliance filters designed to eliminate bad actors and ensure long-term ecosystem stability. Together, South Korea’s structured openness and Singapore’s stringent filtering mechanisms have created a more mature, predictable Asian market, setting a serious tone for the discussions held at Token2049.
Capital Concentration and the Shift Toward Later-Stage Dominance
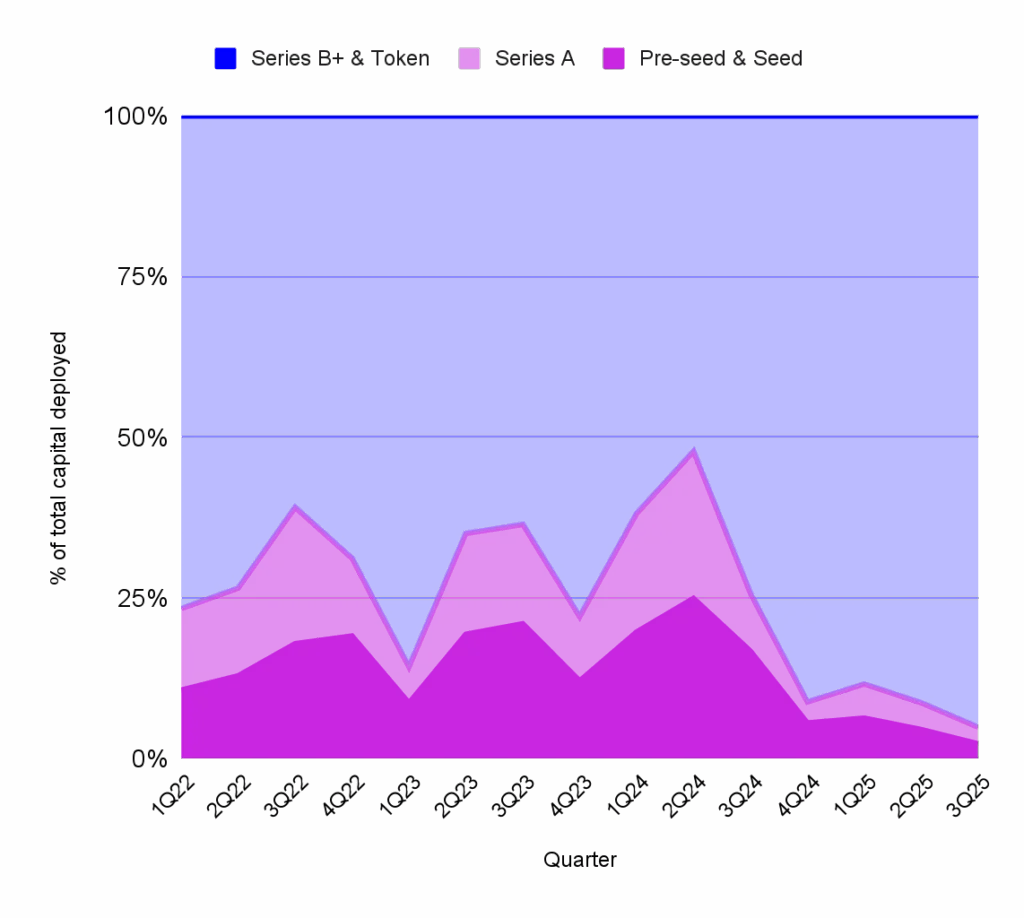
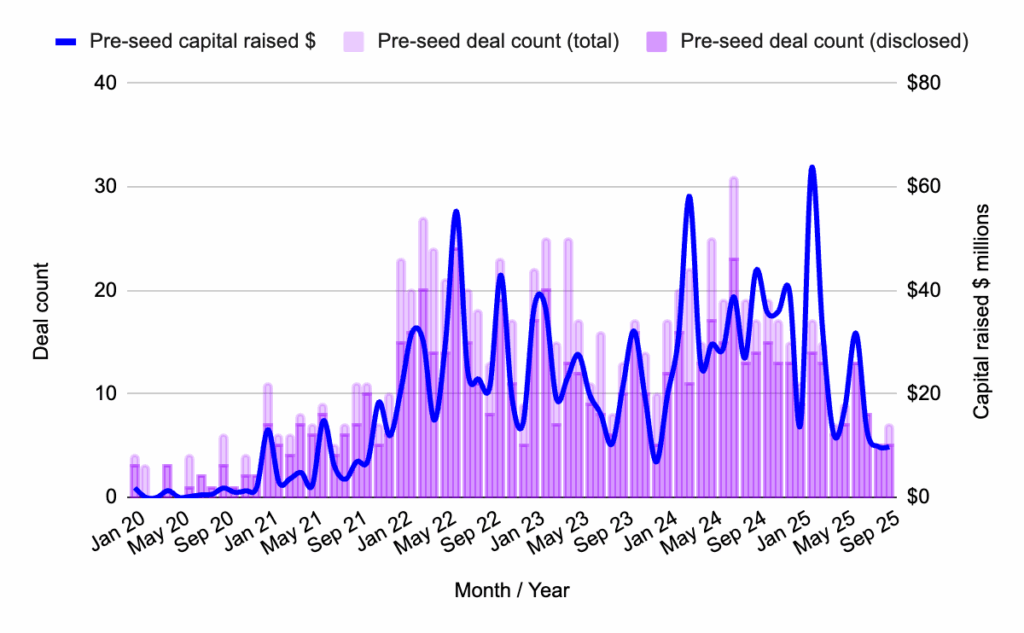
Data presented by analytical firms such as Messari, in conjunction with research from Outlier Ventures, highlights a fundamental restructuring of capital allocation across the venture lifecycle. Leading up to Token2049 Singapore 2025, fundraising data clearly demonstrated a persistent cooling off in pre-seed and seed-stage investments.
Historically, early-stage rounds captured a vast majority of the deal count and a disproportionate share of early capital. However, recent quarters have revealed a pronounced concentration of capital in later stages, specifically Series B rounds and beyond. While the overall volume of early-stage deals has contracted, the average round size for mature, de-risked protocols and platforms has expanded.
This trend is largely driven by fund deployment cycles. Many venture vehicles raised during the historic 2020–2021 fundraising zenith are now fully allocated. With few fresh mega-funds launched in the subsequent bear and consolidation cycles, General Partners are intentionally pivoting their focus toward managing existing winners, optimizing portfolio exits, and supporting companies that have already demonstrated product-market fit. Consequently, capital is flowing where the risk is lower and the operational proof is higher. Founders who can navigate this environment by proving sustainable revenue generation through multiple market cycles are finding willing financial backers.
Data-Led Investment and the Rise of Internal Liquidity Strategies

A defining advantage for venture funds operating in the current market cycle is access to comprehensive, historical data—a luxury that was largely unavailable to crypto-native investors four years ago. Armed with proprietary repositories of benchmarks, cohort analyses, and traction metrics gathered over multiple market cycles, modern GPs are making highly calculated deployment decisions.
Re-allocating capital into existing portfolio winners is increasingly viewed by institutional investors as a rational, high-conviction strategy rather than a defensive measure. Furthermore, some sophisticated venture funds have developed internal over-the-counter (OTC) trading capabilities or dedicated liquidity teams. These internal desks allow firms to secure positions in secondary markets, capturing upside in mature protocols that they may have missed during initial primary fundraising rounds.
This precision-oriented approach reflects a broader industry transition from momentum trading to institutional asset management. Venture firms are utilizing historical failure points as institutional knowledge, reshaping how portfolios are constructed and managed over a typical ten-year fund lifecycle.
Digital Asset Treasuries (DATs) and the Reimagining of Capital Efficiency
Among the most heavily debated topics on the conference stages and in side-meetings was the emergence of Digital Asset Treasuries (DATs). Initially conceptualized as simple bridges to connect traditional finance (TradFi) with decentralized finance (DeFi), DATs have evolved into sophisticated, flexible instruments designed to maximize short-term capital efficiency and manage organizational liquidity.
The "DAT Revolution," as some industry commentators have termed it, underscores a broader institutional demand for optionality and yield-generating protocols. Funds and DAO treasuries are increasingly utilizing these structures to hedge against market volatility, ensuring that idle capital remains productive.
However, this structural shift introduces complex trade-offs. As more institutional and venture capital flows into treasury management and liquid-yielding instruments, proportionally less capital is left available for high-risk, illiquid, early-stage startups. While this may indirectly exacerbate the early-stage funding squeeze for brand-new founders, it nonetheless represents a profound maturation of financial engineering within the crypto ecosystem, moving away from unbounded risk toward calculated stewardship.
LP Expectations and the New Realities of Fund Raising
For emerging and established venture capital funds alike, securing capital from Limited Partners (LPs)—such as pension funds, university endowments, family offices, and fund-of-funds—has become an increasingly rigorous endeavor.
LPs at Token2049 Singapore expressed an uncompromising focus on realized returns, verifiable distribution-to-paid-in (DPI) metrics, and stringent governance structures. The era of writing checks based purely on speculative thematic narratives has officially closed. For new Web3 venture funds entering the market, closing a vehicle now requires extended timelines, transparent reporting, and undeniable proof of operational excellence.
This heightened scrutiny directly influences how venture funds interact with founders. Knowing that LPs demand accountability, VCs are passing those exact standards down to portfolio companies. Founders are expected to demonstrate clear paths to revenue, sustainable tokenomics, and airtight compliance long before approaching institutional investors.
Founder Adaptation: Bootstrapping, Revenue-First Models, and Fair Launches
Responding to this tightened capital environment, Web3 founders are fundamentally altering their go-to-market and fundraising strategies. The conventional playbook of relying on KOL (Key Opinion Leader) marketing blitzes and hype-driven launchpads has largely given way to rigorous bootstrapping and revenue-first business models.
As many founders noted during panel sessions at the event, narrative can capture initial attention, but only tangible performance can sustain a protocol over the long term. Concurrently, new capital formation and distribution models are gaining mainstream traction. Fair launch platforms and community-led token distribution mechanisms—exemplified by protocols and networks such as Virtuals, Hyperliquid, Echo, CoinList, and Legion—are rewriting the rules of early-stage financing.
These platforms emphasize transparency and align the long-term incentives of developers, early adopters, and everyday users. By decentralizing token distribution and removing reliance on predatory early-stage gatekeepers, these models are fostering healthier, more resilient communities that can weather broader macroeconomic downturns.
Building the Future: Ecosystem Catalysts and Infrastructure Focus

As the industry converges around high-utility infrastructure and scalable execution, venture platforms are actively stepping in to bridge the gap between early-stage innovation and institutional readiness. Initiatives such as the Injective Ecosystem Cohort exemplify how modern venture builders operate, targeting specialized builders in decentralized finance (DeFi), cross-chain liquidity, derivatives, and high-performance execution environments.
By providing targeted mentorship, technical resources, and direct alignment with established liquidity networks, these specialized programs help early-stage teams bypass speculative distractions and focus intensely on building enterprise-grade infrastructure. This hands-on approach ensures that the next generation of Web3 protocols is fortified with the operational discipline required to survive and thrive in an institutionalized market.
Conclusion: A Foundation for Sustainable Growth
Token2049 Singapore 2025 will be remembered not as a celebration of unchecked exuberance, but as the moment the Web3 venture capital ecosystem officially crossed the threshold into institutional maturity.
The structural shifts observed throughout the conference—ranging from regional regulatory maturation in South Korea and Singapore to the concentration of capital in later-stage rounds, the adoption of Digital Asset Treasuries, and the prioritization of hard data over marketing hype—point to a permanent evolution. The industry is shedding its speculative skin and replacing it with operational rigor, liquidity discipline, and profound product-market alignment.
For disciplined investors, data-driven funds, and resilient founders who understand how to navigate this elevated standard of excellence, the current landscape represents a golden opportunity. By trading speculative momentum for undeniable utility and measurable traction, the Web3 venture ecosystem has laid a permanent, sustainable foundation for the decades of digital financial innovation ahead.