
The landscape of non-fungible tokens (NFTs) on the Solana blockchain has undergone several transformative cycles since the network first emerged as a viable competitor to Ethereum in early 2021. Among the thousands of projects that have launched, few have maintained the cultural relevance and structural integrity of Galactic Geckos Space Garage (GGSG). Originally minted in September 2021, Galactic Geckos has transitioned from a high-demand profile picture (PFP) collection into a multi-faceted intellectual property (IP) brand, a social adventure club, and a decentralized investment vehicle. As of June 2026, the project remains a cornerstone of the Solana ecosystem, characterized by its hand-drawn aesthetics, deep narrative lore, and a unique governance model that has allowed it to survive where many of its contemporaries have faded into obscurity.
The Genesis of the Galactic Geckos Space Garage
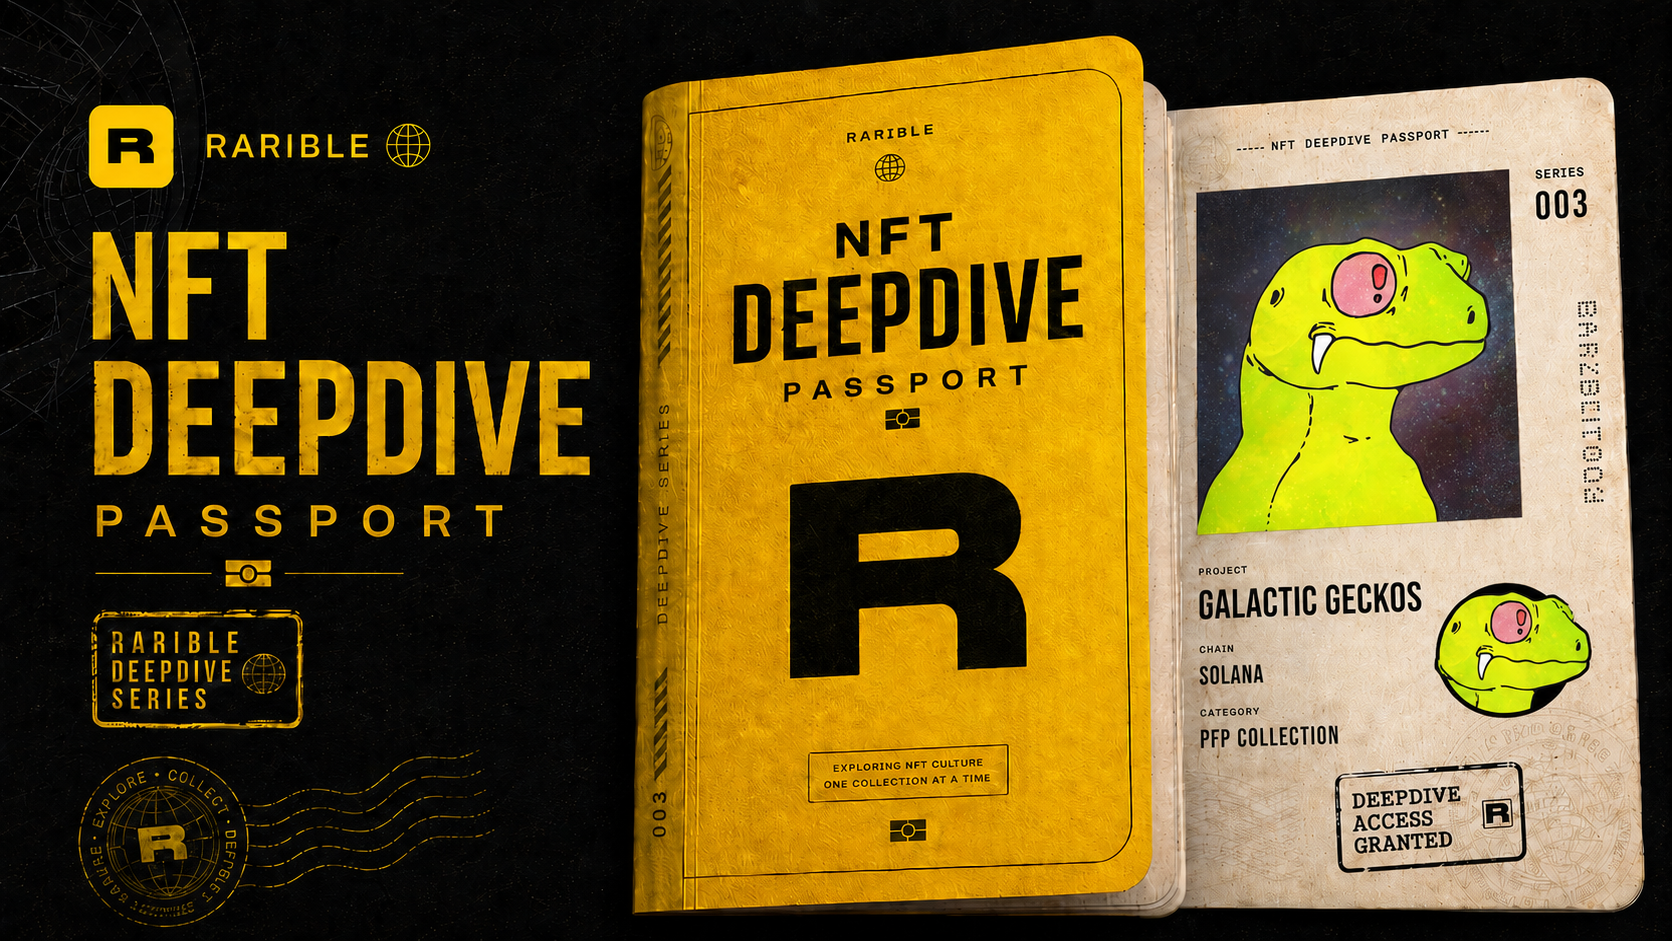
The story of Galactic Geckos began during the "Solana Summer" of 2021, a period marked by explosive growth in network activity and the arrival of the first major NFT collections, such as Degenerate Ape Academy and Solana Monkey Business. When Galactic Geckos launched on September 22, 2021, it introduced a refreshing departure from the prevailing "ape" and "monkey" tropes. The collection consisted of 10,000 unique "warrior-turned-space-racing geckos," each hand-drawn by the acclaimed artist Gossip Goblin.
Gossip Goblin, whose professional background includes work for Magic: The Gathering and high-profile AI film projects, brought a level of artistic pedigree that was rare in the early generative art space. Every gecko was composed of traits from a pool of 162 unique assets, each accompanied by its own specific lore. This narrative-heavy approach was unprecedented at the time, providing a foundation for what would later become a comprehensive "Geckoverse."
The initial mint price of 2 SOL was met with significant demand, and the collection quickly sold out, establishing a secondary market that saw the floor price reach as high as 65 SOL in early 2023. However, the project’s journey was not without its turbulence. In early 2022, the community faced a crisis regarding the alignment of the founding team’s incentives with the long-term health of the project.
The 2022 Buyout and the Shift to Community Governance
A pivotal moment in the chronology of GGSG occurred in February 2022. Following a period of heated negotiations between the community and the original developers, a buyout was orchestrated. The founding team was replaced by a coalition led by Genuine Articles (GA) and a team of dedicated community members. This transition marked one of the first successful community-led takeovers of a major NFT project on Solana.

Under the new leadership, GGSG adopted a "hybrid DAO" model. Unlike traditional decentralized autonomous organizations that can suffer from stagnation due to a lack of clear executive direction, the GGSG model utilizes a lean executive team capable of moving quickly, while maintaining a flat organizational structure that integrates holder feedback. This shift prioritized value accrual for the original NFT holders, moving away from dilutive expansions and focusing on building sustainable utility.
Factionalism and Narrative Architecture
One of the defining characteristics of GGSG is its faction-based system. The 10,000 geckos are divided into four primary factions: Alura, Targari, Martu, and Barada. These are not merely cosmetic labels; they serve as the basis for the project’s lore and community identity. In the fictional world of the Geckoverse, intergalactic warfare has been replaced by brutal spaceship racing, with each faction representing different philosophies and competitive styles.
This narrative architecture has fostered a "social adventure club" atmosphere. Holders do not just own an asset; they belong to "The Garage," a colloquial term for the holder community. This sense of belonging is reinforced by the "Fifth Faction" narrative and the introduction of Enigma Crystals and Concordians—elements that expand the world-building and provide avenues for future media extensions.
Technical Innovations and Staking Mechanics
GGSG has been a pioneer in implementing deflationary mechanics and long-term staking protocols. A significant portion of the supply is currently locked through various mechanisms:
- Immortalization: As of mid-2026, 902 geckos have been "immortalized." This process renders the NFT soulbound, meaning it is permanently removed from the circulating supply.
- The Hero’s Journey: This staking mechanic encourages one-year lockups, rewarding holders with ecosystem benefits and airdrops.
- Staking Statistics: Current data indicates that approximately 7,111 geckos are staked, with the majority committed for 12 months or longer.
With nearly 80% of the total supply either soulbound or staked, the "liquid float"—the number of geckos available for trade on secondary marketplaces like Magic Eden and Tensor—is remarkably thin. This scarcity has been a primary driver of the project’s price stability compared to newer, more volatile collections.
GreenListed and the GeckoDAO Investment Arm
Beyond art and lore, GGSG operates as a sophisticated investment network through "GreenListed," its investment affiliate. GreenListed focuses on supporting builders within the Solana and wider Web3 ecosystems. The group’s most notable achievement to date was leading the seed round for Matrica, a cross-chain token-gating protocol that has since become industry-standard infrastructure.

The success of GreenListed differentiates GGSG from pure PFP projects. It functions as a venture group where the value generated from successful investments is funneled back into the GeckoDAO ecosystem. This "alpha" group culture extends into several sub-sectors, including DeFi optimization, stock trading, and the "Gecko Growth Group," which focuses on helping members monetize their social media presence and professional skills.
Recent Developments and the Move into Gaming
In 2026, the project has focused on expanding its digital footprint through "Galactic Overdrive," a trading-card game (TCG) developed by Space Squid Studios. Unlike many blockchain games that prioritize "play-to-earn" mechanics over gameplay quality, Galactic Overdrive was designed as a "fun-first" title. Alpha testing on iOS and Android revealed high retention rates, with over 20% of players engaging daily without financial incentives.
The broader beta release, expected in the third quarter of 2026, represents a major catalyst for the brand. By moving into the TCG space, GGSG aims to attract a demographic of gamers who may not be traditional NFT collectors, thereby expanding the reach of the IP.
Furthermore, recent collaborations have shown GGSG’s ability to bridge the gap between Solana and other ecosystems. A partnership with Lucid, connected to Yuga Labs’ "Otherside" metaverse, allowed Gecko holders to secure allocations for LucidAI. This cross-chain participation signals that while GGSG is a Solana-native project, its brand ambitions are network-agnostic.
Market Analysis and Future Outlook
As of June 22, 2026, the floor price for a Galactic Gecko sits at approximately 6.26 SOL (roughly $455). While this is lower than the all-time high of $4,400 recorded in late 2023, the project’s health is measured by its "stickiness" rather than just its price point. With nearly 3,000 unique holders and a highly engaged DAO, GGSG remains one of the most stable communities in the digital asset space.
The roadmap for the remainder of 2026 includes:
- Physical Expansion: Confirmed plans for IRL merchandise, apparel, and physical trading cards.
- RWA Partnerships: Ongoing discussions regarding Real World Asset (RWA) partnerships where GGSG would serve as the exclusive NFT partner.
- Collector Profiles: The launch of holder badges and tools to reward long-term collectors and surface rare assets within the community.
Professional Implications and Broader Impact
The trajectory of Galactic Geckos Space Garage offers several lessons for the broader NFT industry. First, it demonstrates the viability of the "community buyout" model when a project’s original founders fail to meet expectations. Second, it highlights the importance of "under-marketing"—a strategy GGSG employs to avoid the boom-and-bust cycles associated with hyper-active hype machines. By favoring "surprise-and-delight" moments over rigid roadmaps, the project has maintained a high level of trust with its core base.
Furthermore, GGSG’s success without external venture capital fundraising proves that NFT projects can be sustainable through internal revenue generation and strategic ecosystem investments. As the industry moves toward more mature, utility-driven models, GGSG’s "hybrid DAO" and "Lore-as-a-Service" approach may serve as a blueprint for future IP-based collections.
In conclusion, Galactic Geckos Space Garage is no longer just a collection of digital images; it is a resilient digital nation-state with its own economy, culture, and territorial ambitions in the metaverse. While the public-facing momentum may at times appear quieter than that of newer, flashier projects, the underlying infrastructure and community loyalty suggest that GGSG is positioned for long-term endurance in the ever-evolving Solana landscape. The upcoming launch of Galactic Overdrive and the expansion into physical goods will be the next major tests of whether this "OG" project can successfully transition into a mainstream entertainment brand.